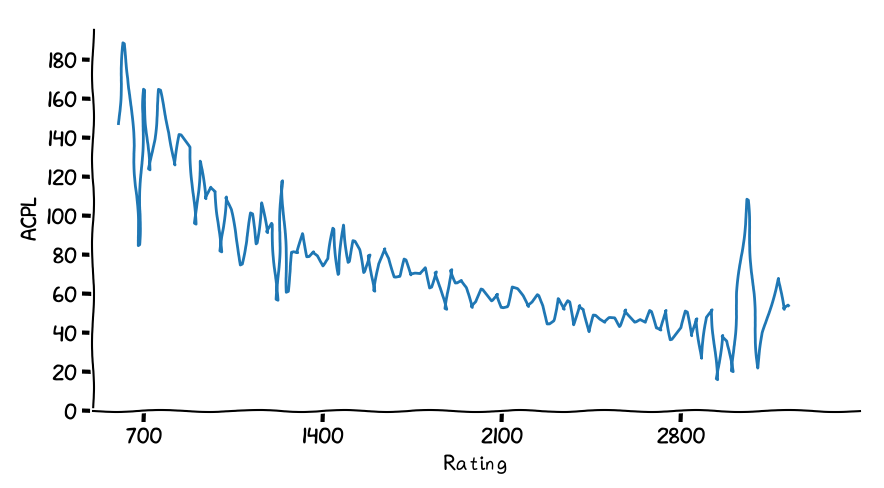
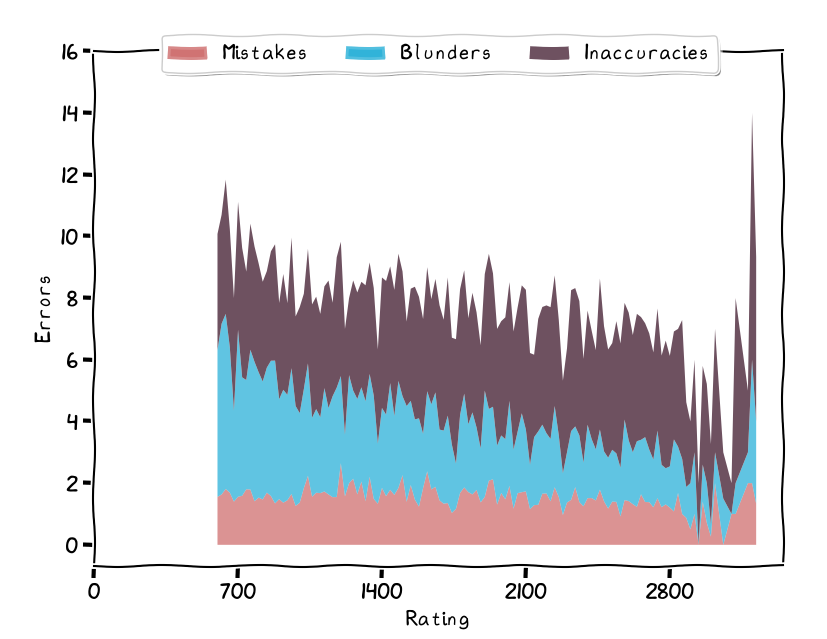
2 scripts to generate graphs representing Rating vs ACPL and Rating vs Errors using Lichess’s API
- Optional: Create a python virtual environment and then activate it
- Install dependencies:
pip install -r requirements.txt
game_id_collector.py gets game IDs for elo in the specified range.
python game_id_collector.py -l [lower elo bound for games to be collected] -h [upper elo bound for games to be collected] -n [number of games to be collected per 100 elo] -t [type of game mode]
-l and -h need to be divisible by 100 i.e. 600/700/800... with a minimum of 600 and maximum of 2900.
-t should be from the following list [0, 1, 2, 6, 3, 4, 18, 11, 12, 15 ,13 ,14 ,16, 17] representing UltraBullet, Bullet, Blitz, Rapid, Classical, Correspondence, Crazyhouse, Chess960, King of the Hill, Three-check, Antichess, Atomic, Horde, Racing Kings
For example if you call game_id_collector.py -l 600 -h 1000 -n 100 -t 2. The script will collect games for 100 games for each of the following ranges: 600-700, 700-800, 800-900, 900-1000 and place them into files called 600-700-100.txt, 700-800-100.txt ....
python display_stats.py utilizes the collected game IDs to calculate ACPL and Errors.
https://kwojcicki.github.io/blog/CHESS-BLUNDERS
This script uses matplotlib.xkcd which requires several special fonts. You can get them from the following two repos: https://github.com/ipython/xkcd-font/tree/master/xkcd/build and https://github.com/imkevinxu/xkcdgraphs.
You may need to restart your computer after installing and potentially clear matplotlib's cache